
Patients who started care in your network go somewhere else. Do you have quick access to the physician-level picture that tells you where to act?
See which physicians are routing cases to competitors, how your competitive position has shifted over three years, and where the concentration of leakage sits by service line and site of care. This claims-based analysis puts that picture together for your system — delivered in two weeks, at no cost.
30 min | One call to understand your priorities
2 weeks | Findings delivered
3 years | of market claims data analyzed
See how your market share has moved — by service line, by geography, and against the specific competitors who are growing in your footprint.
Out-of-network referrals traced to individual physicians — volume, estimated revenue, and destination. Not a system-level estimate.
Patients who started care in your network and finished it somewhere else. Which competitors and sites of care are capturing them. Where are you most exposed.
A capital committee doesn't pause while your analytics team builds a query. A competitor expanding into your primary market doesn't hold while you figure out what the referral data means.
Most health systems already have something. The question is whether it answers the right questions fast enough to matter — and whether it's built on data that reflects what's actually happening across your market, not just inside it.
An analysis of this scope has traditionally required a consulting engagement and a timeline that outlasted the strategic decision it was meant to inform. The data isn't the bottleneck. What's changed is what it takes to structure it, link it, and turn it into an answer around a specific question.
Kythera is built on AI-ready data infrastructure. A strategist states the question in plain language — the infrastructure resolves it. No technical queries. No data submission from your team. No months of waiting. That's why a 30-minute call is all we need, and two weeks is all it takes.
The report below is what that looks like in practice.
For those serious about reducing risk around their Strategic Bets, health systems connect their internal billing data to our market claims. This creates more confidence in the intelligence because it identifies where blind spots exist in analysis; effectively telling you what you don't know.
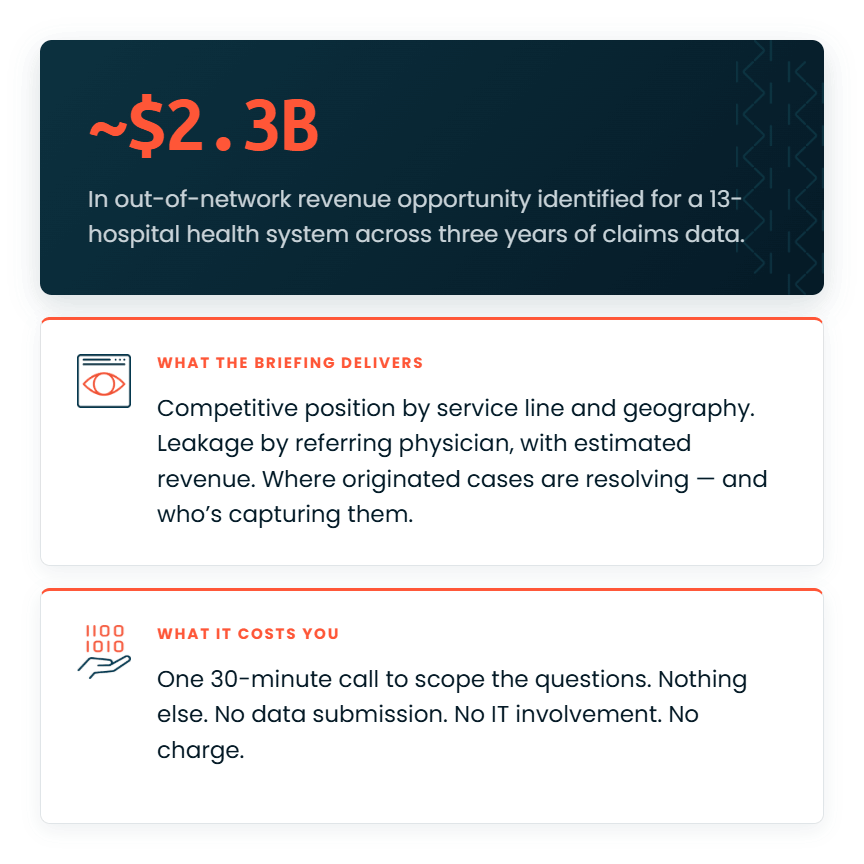

An analysis for a midwest health system surfaced ~$2.3B in out-of-network revenue opportunity. It breaks the opportunity down by referral pattern, service line, and provider concentration — showing where originated cases resolve outside the network, and who's capturing them.



©2026 Kythera Labs, Inc. All rights reserved.
